A Year-End Strategy Guide for STR Owners
The December 2025 Pulse Report: A Year-End Strategy Guide for STR Owners
The latest US STR Pulse Monthly Report from Key Data offers a clear snapshot of the short-term rental market as we close out 2025. For property managers and investors, the data reveals a landscape of resilience and steady growth across several major U.S. markets.
Below is a breakdown of the national highlights, a focused look at the Southeast region, and actionable strategies to help owners outperform market averages.

National Highlights: Regional Winners
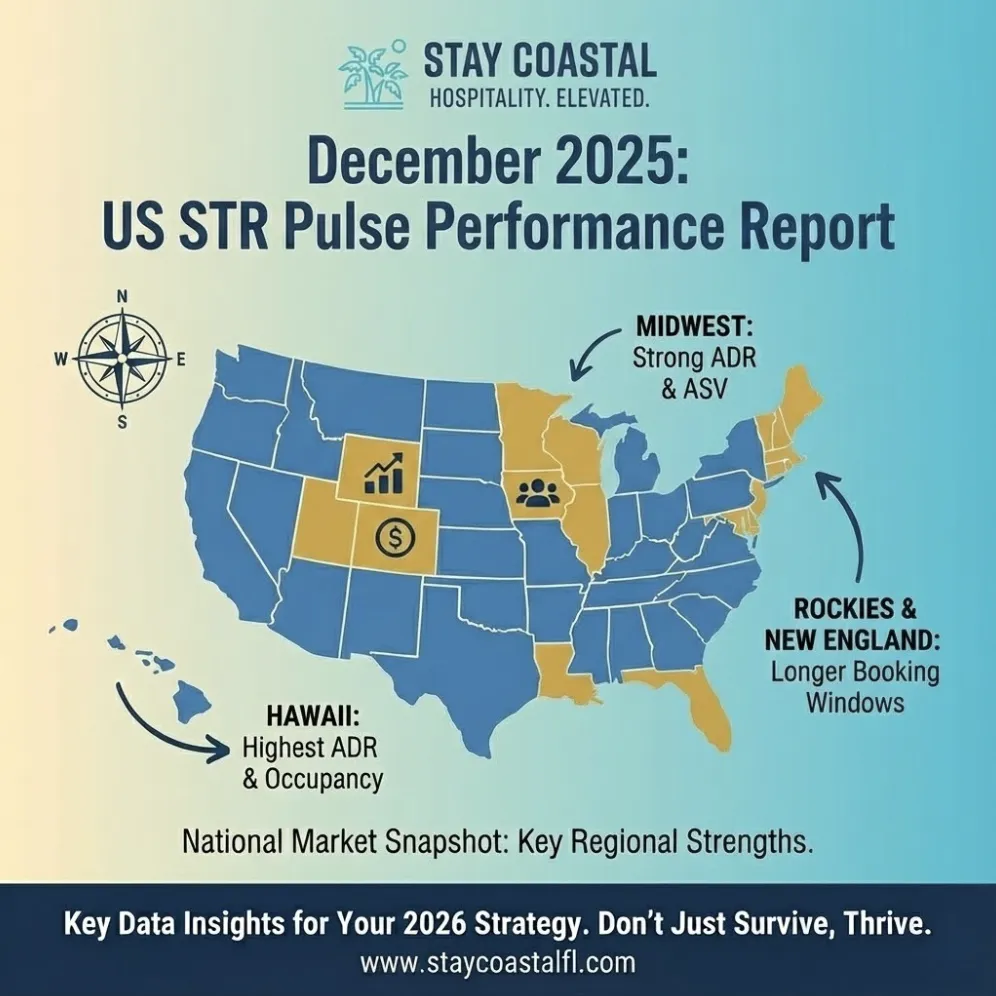
The report shows varied performance across the United States over the last 30 days compared to the same period last year:
• The Midwest
The Midwest emerged as a strong performer. While occupancy fluctuated, the region delivered solid results in Average Daily Rate (ADR) and Average Stay Value (ASV), indicating higher guest spend per stay.
• Hawaii
Hawaii continued to command premium pricing, reporting the highest ADR in the study at $510, alongside a strong 43% occupancy rate.
• Rocky Mountains & New England
These regions stood out for extended booking windows, with the Rocky Mountains averaging 62 days and New England 47 days, signaling that guests are planning seasonal trips further in advance.
Regional Deep Dive: The Southeast
For owners operating in the Southeast, December 2025 data points to healthy and stabilized growth. While other regions struggled to maintain occupancy, the Southeast showed positive movement across nearly all key performance indicators.
Southeast Performance Scorecard (December 2025 vs. December 2024)
• Occupancy: 24% (up 4% year-over-year)
• Average Daily Rate (ADR): $259 (up 2% year-over-year)
• RevPAR: $61 (up 7% year-over-year)
• Average Stay Value (ASV): $1,201 (up 1% year-over-year)
• Booking Window: 53 days (0% change)
• Length of Stay (LOS): 5.5 days (down 1% year-over-year)
What This Means for Southeast Owners
Revenue efficiency is improving
The Southeast recorded a 7% increase in RevPAR, one of the strongest growth rates among all regions. A modest increase in ADR combined with higher occupancy is creating a compounding revenue effect for owners.
The 53-day booking window remains stable
With no year-over-year change, booking behavior has remained predictable. This allows owners to plan marketing efforts and pricing strategies with confidence, knowing most guests are booking roughly two months in advance.
Shorter stays, higher value
Although the average length of stay decreased slightly to 5.5 days, the Average Stay Value increased to $1,201. Guests are staying for fewer nights but spending more overall, validating premium pricing strategies for shorter stays.
Important Context: Avoiding the “Average” Trap
While the data paints a positive picture, market averages are not a guarantee of individual property performance. These figures combine thousands of listings across different property types.
Performance differences are often driven by:
• Bedroom count – Larger homes typically achieve higher ADRs and longer booking windows, even with lower occupancy percentages.
• Amenities – Properties with tier-one amenities such as private pools, hot tubs, or game rooms consistently outperform regional averages.
• Micro-location – Proximity matters. A home “steps from the beach” will perform very differently than one requiring a short drive, even within the same ZIP code.
The takeaway: use market reports as a directional compass, not a precise map for your specific property.
Four Ways to Boost Revenue If You’re Underperforming
If your property is not matching the growth shown in this report, it may be time to reassess your strategy:
Re-evaluate dynamic pricing
Static pricing limits revenue. Dynamic pricing tools adjust rates daily based on demand, local events, and competitor activity. High occupancy may signal underpricing, while extended vacancy can indicate rates above market tolerance.
Audit listing photography and SEO
Your listing is your storefront. Ensure your first five photos showcase your strongest selling points and that titles and descriptions include keywords guests actively search for, such as “Fast WiFi,” “Pet Friendly,” or “Ocean View.”
Lean into pet-friendly demand
Data consistently shows pet-friendly listings earn higher revenue and occupancy. Where allowed, pet policies combined with appropriate fees can unlock a powerful demand segment.
Upgrade tier-two amenities
You don’t need major renovations to improve performance. Reliable WiFi, quality coffee setups, smart TVs, and premium linens often lead to better reviews, improved ranking, and higher revenue.
Frequently Asked Questions
How is the Southeast short-term rental market performing in late 2025?
The Southeast market is performing well, with a 7% year-over-year increase in RevPAR and a 4% increase in occupancy as of December 2025.
What is the average booking window for Southeast vacation rentals?
The average booking window is 53 days, unchanged from the previous year.
Are vacation rental prices dropping in the Southeast?
No. The Average Daily Rate increased by 2%, reaching $259 per night in December 2025.
Why is my occupancy lower than the regional average?
Regional averages combine all property types. Your occupancy may differ based on bedroom count, amenities, location, and proximity to major attractions.
What is the average length of stay in the Southeast?
The average length of stay is 5.5 days, slightly lower than last year, while Average Stay Value increased to $1,201.
